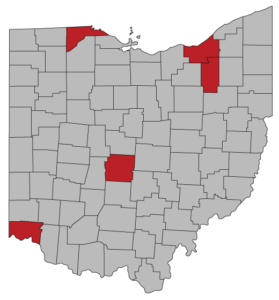
Ohio is in line with the national trend– the Death Penalty Information Center recently found that a paltry 2% of counties across the nation account for the most of the death sentences at an enormous cost.

Ohio’s death penalty system is continually used in just ten of the 88 counties. The ten frequent-use counties account for 79% of those cases, while the vast majority of Ohio counties (78) account for just 21% of death cases. More glaring, the top five frequent-use counties (Cuyahoga, Franklin, Hamilton, Lucas and Summit) are responsible for 68% of all Ohio death cases. This phenomenon–a small number of counties disproportionately using the death penalty system–is not isolated to Ohio. In fact when looking across all counties in the United States in 2014, new death sentences occurred in only 2% of U.S. counties.1
This geographic disparity is largely due to the available financial resources of the county and personal views of the prosecuting attorney. From the time the current law went into effect in 1981 to the end of 2014, Ohio prosecutors initiated 3,168 death penalty cases.2 The personal views and practices of a prosecuting attorney are another extra-legal factor contributing to disparate death sentences in Ohio’s eighty-eight counties. There are ample examples in both large and small counties alike. For example, in a 2015 report, OTSE compared similarly situated counties and their use of the death penalty. When comparing Trumbull and Stark counties (both counties had similar homicide/1000 residents at 0.87 and 0.84 respectively), we found that for every 100 homicides in each county, Trumbull sentences eight individuals to death compared to just two death sentences in Stark.3 The Stark county prosecutor uses plea deals and the Trumbull county prosecutor does not. The most compelling example is found in Cuyahoga county. Under the direction of one elected prosecutor, Cuyahoga County initiated, on average, 29.8 new death penalty cases each year.4 Under the most recent prosecutor, Cuyahoga averaged 2.5 new death penalty cases each year.5 Homicides and death-eligible crimes did not change, rather the views of the elected prosecutor did.
In 2016, new cases came from just ten counties. Nearly 28% of all new indictments came from Cuyahoga county alone, and 22% came from Butler county. Aside from Cuyahoga and Butler counties, the only county with more than one new indictment was Franklin county filing two. Collectively, these three counties account for 61% of the new indictments filed in 2016. This trend indicates that the capital indictment process is concentrated among few Ohio counties.
1 Dieter, Richard. The Death Penalty Information Center, “The 2% Death Penalty: How a Minority of Counties Produce Most Death Cases at Enormous Costs to All.” October 2013.
2 The Supreme Court of Ohio, “Supreme Court of Ohio Capital Indictment Table.” Tabs 1981 through 2014. Last accessed March 16, 2017. http://www.supremecourt.ohio.gov/Clerk/capitalIndictment/default.asp
3 Werner, Kevin. Ohioans to Stop Executions, “A Relic of the Past: Ohio’s Dwindling Death Penalty.” pg 55-60. September 2016.
4 The Supreme Court of Ohio, “Supreme Court of Ohio Capital Indictment Table.” Tabs 1999 through 2016. Last accessed March 16, 2017. http://www.supremecourt.ohio.gov/Clerk/capitalIndictment/default.asp Term of William D. Mason, 1999-2012. N=418 death penalty cases.
5 Ibid. Term of Timothy McGinty, 2013-2016. N=10 death penalty cases.